


| Heap details |
The structure of a page heap block
With full page heap enabled for end of buffer overrun type of bugs the program will access violate instantly. These failures are easy to debug because the current stack trace points directly to the broken code. If normal page heap is used or the corruption happens in the small fill pattern at end of buffer for alignment reasons (see subsection about unaligned allocations) the corruption will be detected only when the block is freed. In these cases more involved detective techniques are required. To make life easier in such cases the page heap manager places a header before all allocations (full and normal). This header contains a few valuable bits of information (owning heap, user requested size and stack trace for the allocation in some cases). The structure of the full and normal page heap blocks is described below.
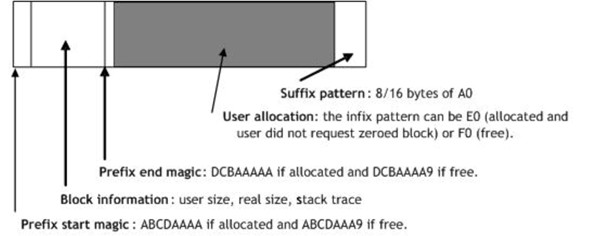
Normal page heap block structure
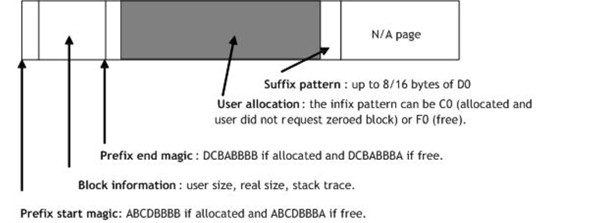
Full page heap block structure
The Heap field stores the owning heap. The user requested size for the block is in RequestedSize. The stack can be obtained by issuing a dds debugger command at StackTrace address. The best way to get a dump of this structure is to use the dt debugger command:
dt DPH_BLOCK_INFORMATION ADDRESS
The StackTrace field will not always contain a non-null value for various reasons. First of all stack trace detection is supported only on x86 platforms and second, even on x86 machines the stack trace detection algorithms are not completely reliable. If the block is an allocated block the stack trace is for the allocation moment. If the block was freed, the stack trace is for the free moment.
Special fill pointers
The page heap manager fills the user allocation with values that will look as kernel pointers. This happens when the block gets freed (fill value is F0) and when the block gets allocated but no request is made for the block to be zeroed (fill value is E0 for normal page heap and C0 for full page heap). The non-zeroed allocations are typical for malloc/new users. If there is a failure (access violation) where a read/write is attempted at addresses like F0F0F0F0, E0E0E0E0, C0C0C0C0 then most probably you hit one of these cases.
A read/write at F0F0F0F0 means a block has been used after it got freed. Unfortunately you will need some detective work to find out which block caused this. You need to get the stack trace of the failure and then inspect the code for the functions on the stack. One of them might make a wrong assumption about an allocation being alive.
A read/write at E0E0E0E0/C0C0C0C0 means the application did not initialize properly the allocation. This requires also code inspection of the functions in the current stack trace. Here it is a contorted example of this kind of failure. In a test process an access violation while doing a HeapFree on address E0E0E0E0 is noticed. It turned out that the test allocated a structure, did not initialize it correctly and then called the destructor of the object. Since a certain field was not null (it had E0E0E0E0 in it) it called delete on it.