序号
| 5
|
分类
| Visio 绘图引擎
|
模块名称
| Vole Diagram
|
对标产品
| Microsoft Visio
|
特有功能
| 提供类似 Microsoft Visio 的绘图功能,支持通过拖拽模具(Stencil)快速构建流程图、UML 图等专业图表。
|
软件主页
| https://www.sanwhole.com/Products/VoleDiagram
|
典型应用场景
| 一、软件工程与系统设计
- 系统建模与需求分析:通过类图(Class Diagram)、用例图(Use Case Diagram)等可视化工具,定义软件架构中的对象关系与交互逻辑,降低开发团队沟通成本。例如,利用活动图(Activity Diagram)描述电商订单流程的状态变迁,确保业务逻辑的完整性。
- 动态行为追踪:借助状态图(State Diagram)监控对象的生命周期(如订单状态 “未支付→已发货” ),优化复杂系统的异常处理机制。
- 业务流程建模: 适用于 ERP、OA 等系统的审批流程可视化设计。
- IT 架构管理: 绘制网络拓扑图、微服务依赖关系图,支持动态更新与层级展开。
- 教育工具开发: 用于数据结构教学中的图论算法演示(如 Dijkstra 算法)。
二、跨领域研究与数据可视化
- 概念关系抽象:通过欧拉图(Euler Diagram)展示集合间的逻辑重叠关系,适用于学术研究中的概念比对与知识图谱构建。
- 空间数据分析:应用维诺图(Voronoi Diagram)划分地理数据或资源分布,辅助气象预测、路径规划等场景的决策优化。
三、团队协作与教育培训
- 多人协作建模:支持部署图(Deployment Diagram)与组件图(Component Diagram)的协同编辑,便于研发团队规划高并发系统的物理架构(如负载均衡策略)。
- 教学演示工具:利用时序图(Sequence Diagram)动态展示交互流程,帮助学生理解API调用或算法执行的时序逻辑。
四、移动办公与离线场景适配
- 便携式图表设计:结合Vole Office的轻量化特性(U盘即插即用),可快速生成标准化的架构图或流程图,适配外勤汇报与临时方案讨论。
- 离线状态恢复:支持图表编辑进度的自动保存与场景恢复(如多分屏布局),确保野外勘探或断网环境下工作的连续性。
核心功能与场景适配表
需求场景
| 适用图表类型
| 核心支撑能力
|
系统架构设计
| 类图/组件图
| 静态结构建模
|
业务流程优化
| 活动图/状态图
| 动态行为追踪
|
学术研究
| 欧拉图/维诺图
| 逻辑关系可视化
|
协作与教育
| 部署图/时序图
| 多端兼容与协同编辑
|
离线场景
| 自定义流程图/架构图
| 无依赖运行与恢复机制
|
通过集成UML标准化建模工具与跨领域图表功能,Vole Diagram在软件工程、科研分析及移动办公场景中展现出高度的灵活性与专业性。
|
Serial number
| 5
|
Classification
| Visio drawing engine
|
Module Name
| Vole Diagram
|
Benchmark products
| Microsoft Visio
|
Unique Features
| It provides drawing functions similar to Microsoft Visio , and supports the rapid construction of professional diagrams such as flowcharts and UML diagrams by dragging stencils .
|
Software Home Page
| https://www.sanwhole.com/Products/VoleDiagram
|
Typical application scenarios
| 1. Software Engineering and System Design
- System Modeling and Requirements Analysis : Define the object relationships and interaction logic in the software architecture through visual tools such as Class Diagram and Use Case Diagram to reduce the communication cost of the development team. For example, use Activity Diagram to describe the state transition of the e-commerce order process to ensure the integrity of the business logic.
- Dynamic Behavior Tracking : Use state diagrams to monitor the life cycle of objects ( such as order status "unpaid → shipped " ) and optimize the exception handling mechanism of complex systems.
- Business Process Modeling : Applicable to the visual design of approval processes for ERP , OA and other systems.
- IT Infrastructure Management : Draw network topology diagrams and microservice dependency diagrams, supporting dynamic updates and hierarchical expansion.
- Educational Tools Development : Used for demonstration of graph theory algorithms in data structure teaching (such as Dijkstra's algorithm).
2. Cross-disciplinary research and data visualization
- Conceptual relationship abstraction : The logical overlapping relationship between sets is displayed through the Euler Diagram, which is suitable for concept comparison and knowledge graph construction in academic research.
- Spatial Data Analysis : Use the Voronoi Diagram to divide geographic data or resource distribution, and assist in decision-making optimization in scenarios such as weather forecasting and route planning.
3. Teamwork and Education and Training
- Multi-person collaborative modeling : Supports collaborative editing of deployment diagrams and component diagrams, making it easier for R&D teams to plan the physical architecture of high-concurrency systems (such as load balancing strategies).
- Teaching Demonstration Tool : Use sequence diagrams to dynamically display the interaction process to help students understand the timing logic of API calls or algorithm execution.
4. Mobile office and offline scene adaptation
- Portable chart design : Combined with the lightweight features of Vole Office (USB flash drive plug-and-play), standardized architecture diagrams or flow charts can be quickly generated, suitable for field reporting and temporary solution discussions.
- Offline status recovery : Supports automatic saving of chart editing progress and scene recovery (such as multi-split screen layout), ensuring the continuity of work in field exploration or disconnected network environment.
Core functions and scene adaptation table
Demand Scenario
| Applicable chart types
| Core support capabilities
|
System architecture design
| Class diagram/component diagram
| Static Structural Modeling
|
Business process optimization
| Activity Diagram/State Diagram
| Dynamic behavior tracking
|
Academic Research
| Euler diagram/Virno diagram
| Logical relationship visualization
|
Collaboration and Education
| Deployment diagram/sequence diagram
| Multi-terminal compatibility and collaborative editing
|
Offline scenario
| Customized flowchart/architecture diagram
| No dependency operation and recovery mechanism
|
By integrating UML standardized modeling tools and cross-domain diagram functions, Vole Diagram demonstrates high flexibility and professionalism in software engineering, scientific research analysis and mobile office scenarios.
|
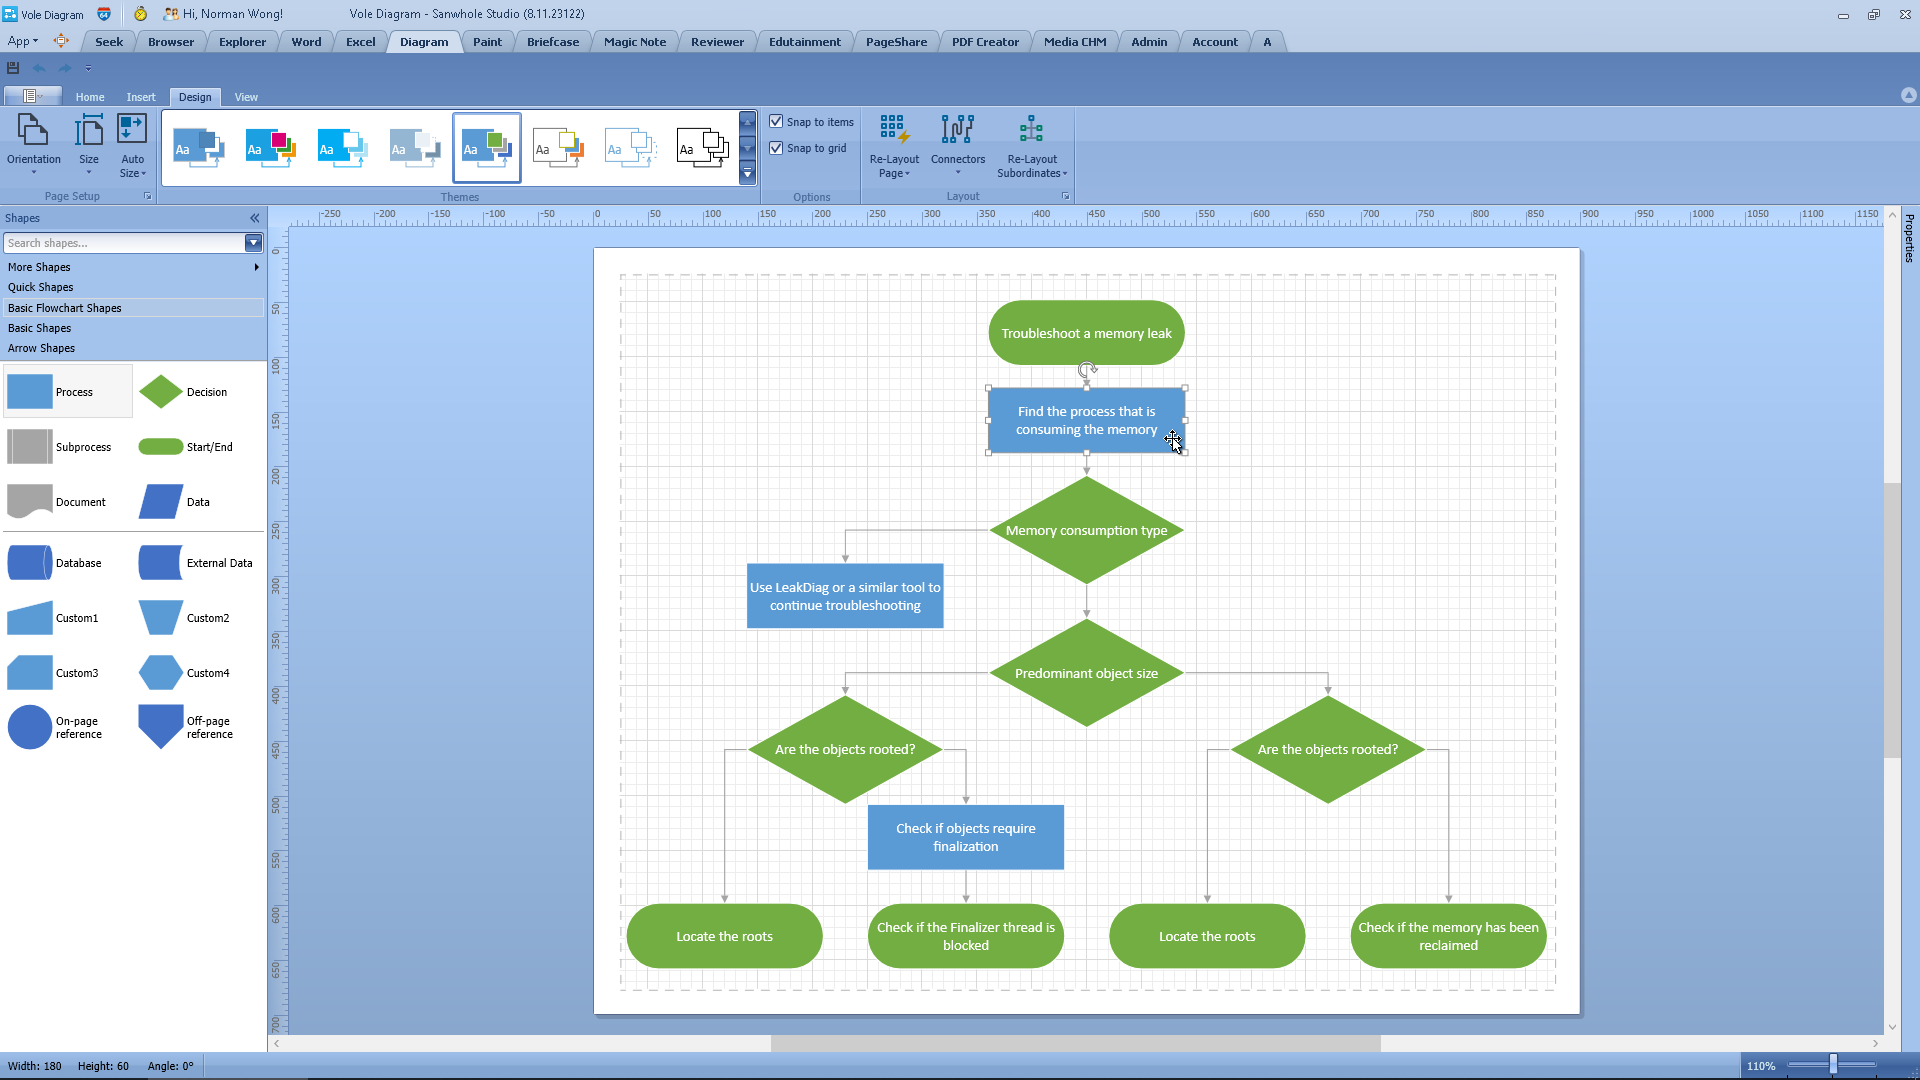
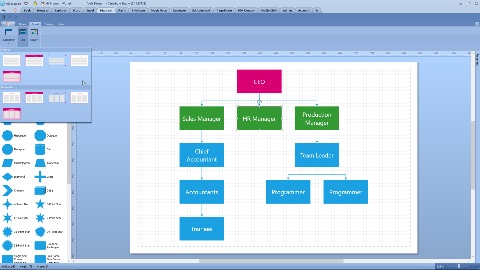
Diagram Designer
The Diagram control includes both a Visual Studio diagram designer and a runtime designer that replicates the features and capabilities found in Microsoft Visio. You can create diagrams at design time and allow your users to draw org charts, flowcharts, and diagrams from scratch at runtime.
The Diagram Designer includes the following features:
• Save/Load Diagrams
• Visio-inspired and Custom Diagram Themes
• Print Diagrams
• Export Diagrams to PDF, SVG, PNG, JPEG, BMP, GIF
• Undo/Redo and Clipboard Operations
• Select and Transform Shapes
• Rulers and Dynamic Grid
• Pan, Zoom, Scroll
|
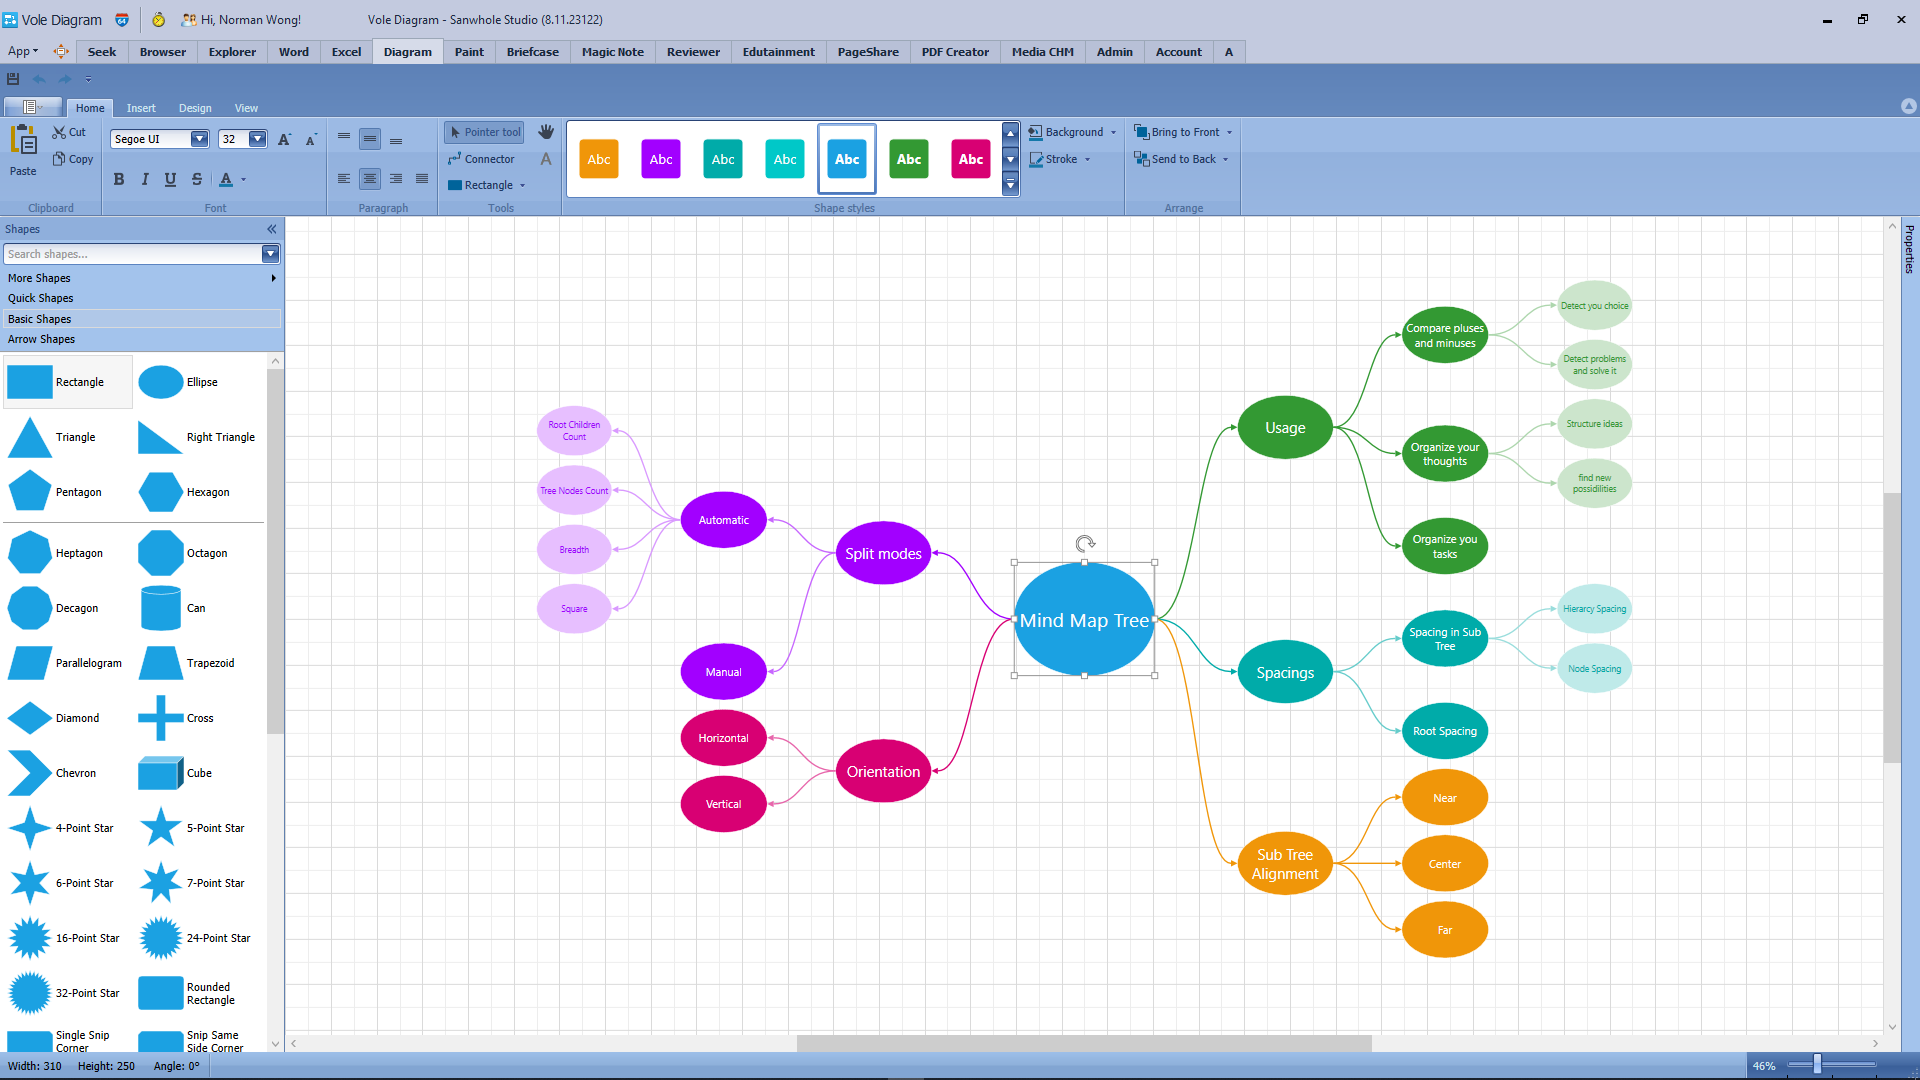
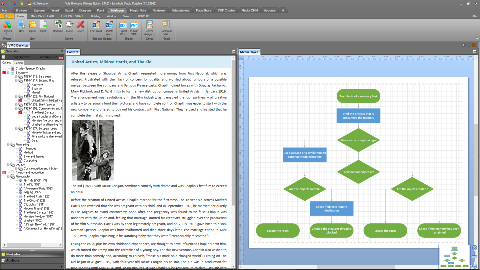
Shapes and Connectors (Items)
From basic and FlowChart shapes to software and SDL diagram shapes, the Diagram control ships with over 130 built-in shapes, containers, visuals, and connectors. You can also import SVG graphics, create custom shapes, and customize shape paths.

The advanced features include:
• Text Editing
• Drag & Drop
• Resize and Rotate
• SVG & Raster Graphics
• Shape Containers & Lists
• Automatic Routing
|
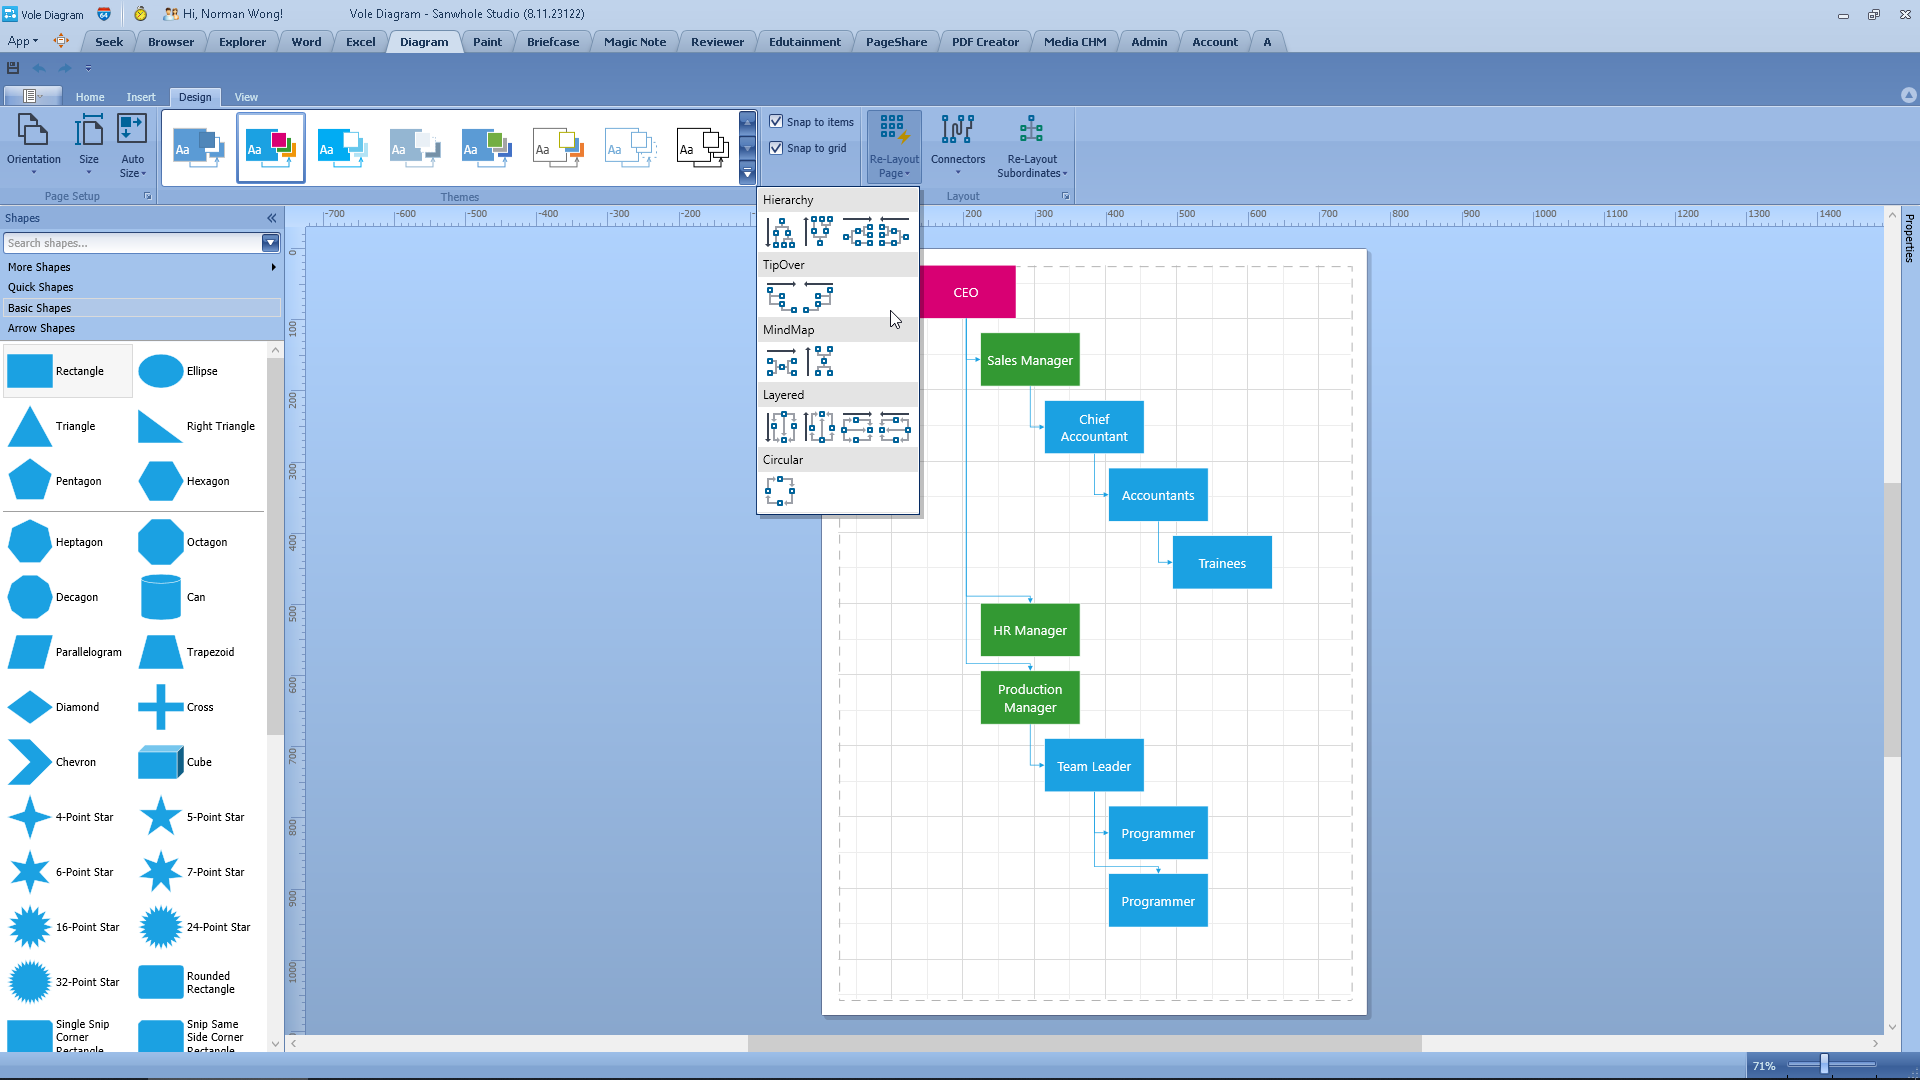
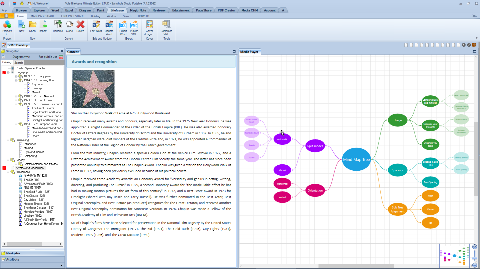
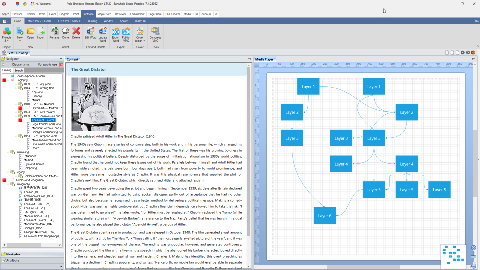
Automatic Layout
The Diagram control allows you to arrange shapes quickly to create well organized diagrams.
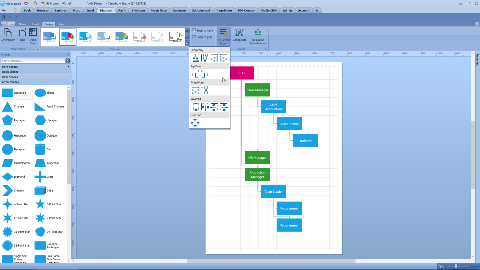
You can use the following shape arrangement options (algorithms):
• Tree Graph
• Layered (Sugiyama) Graph
• Circular Layout
• Tip-Over Tree Layout
• Mind-Map Tree Layout
• Org Chart Layout
|
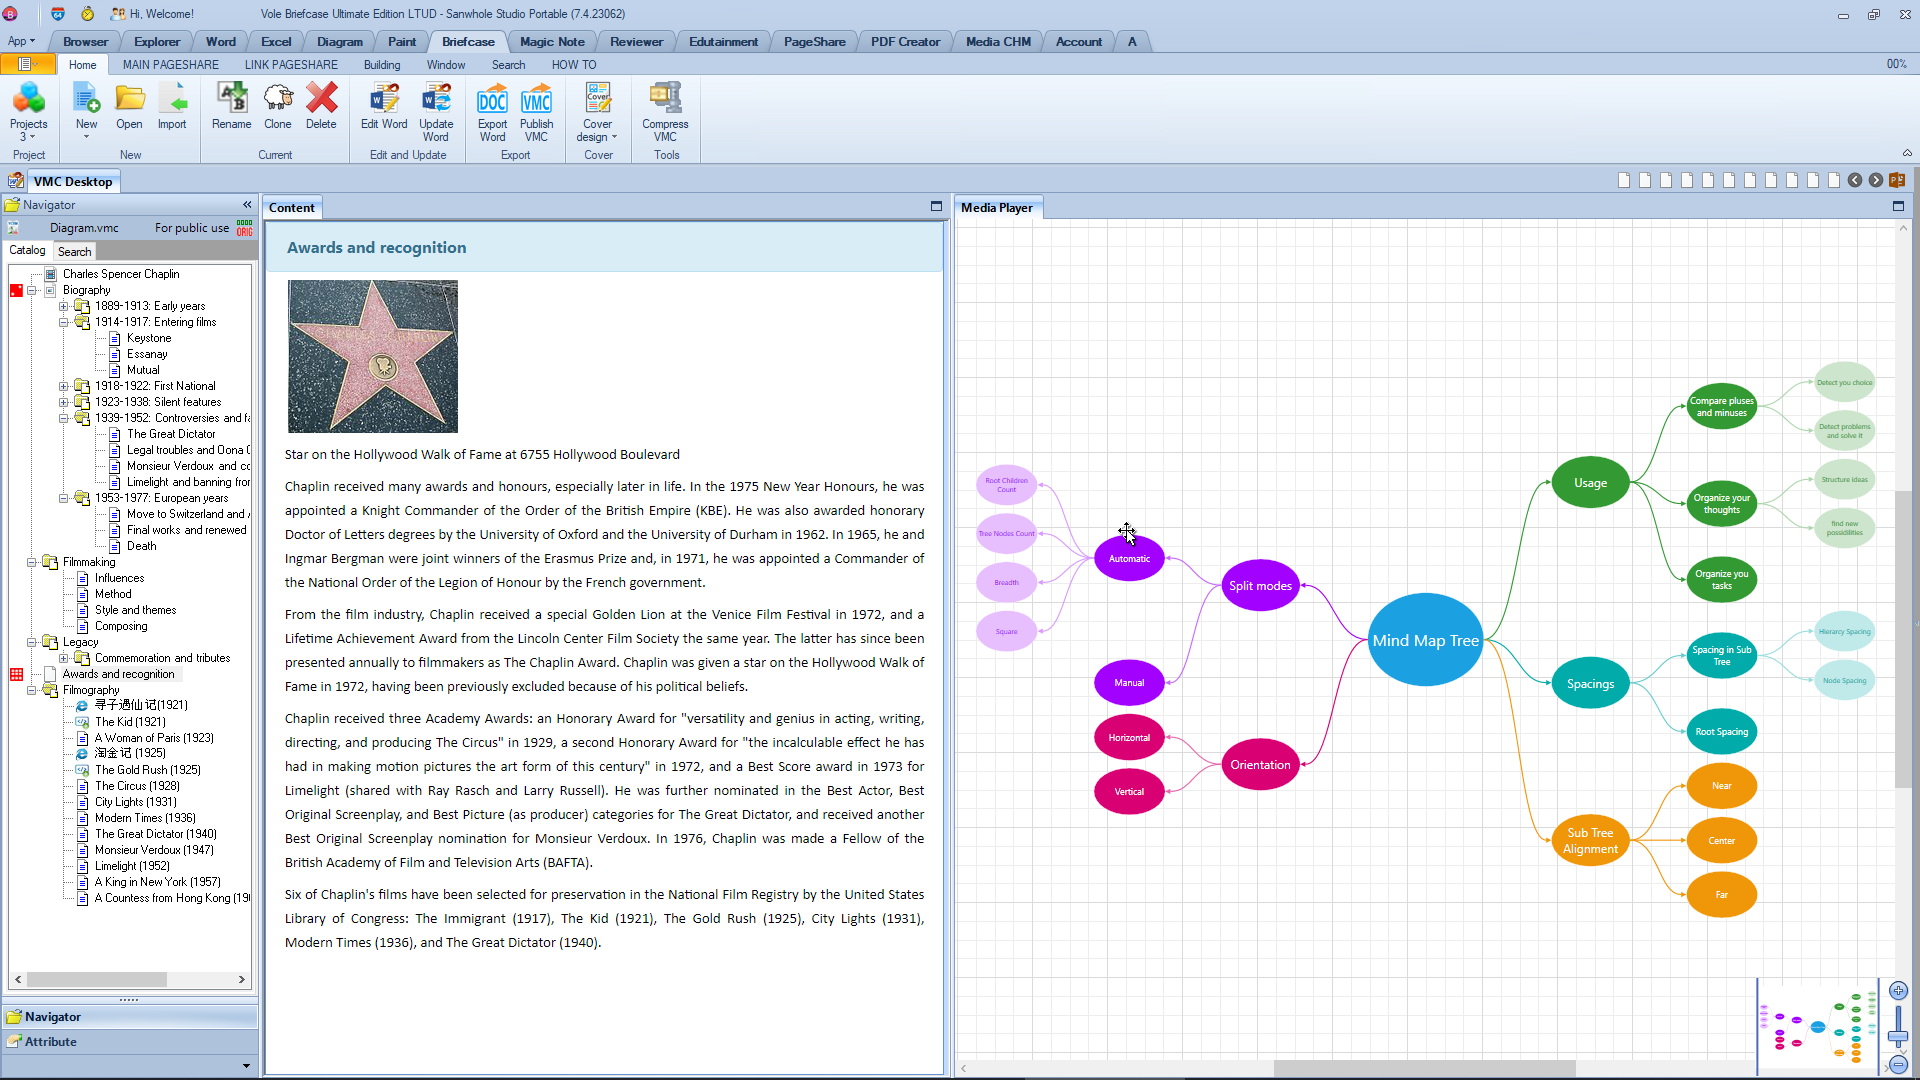
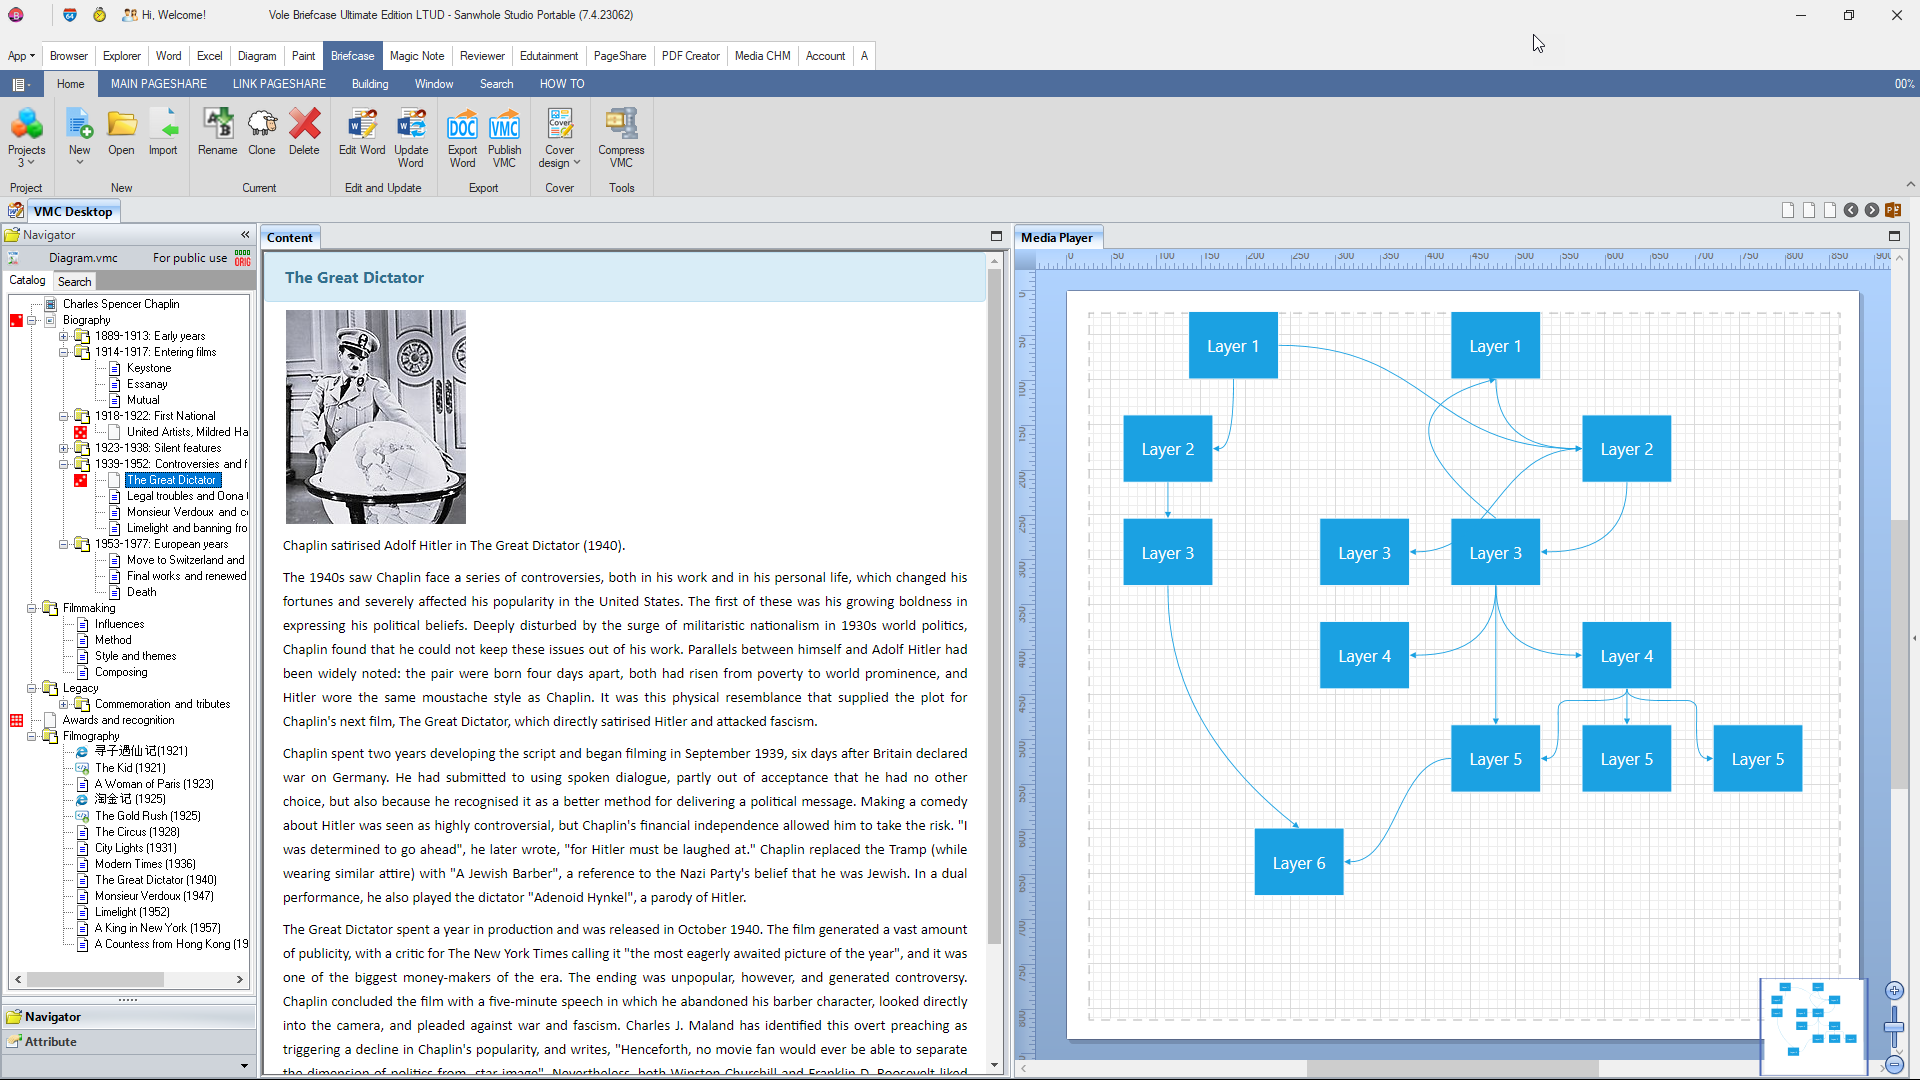
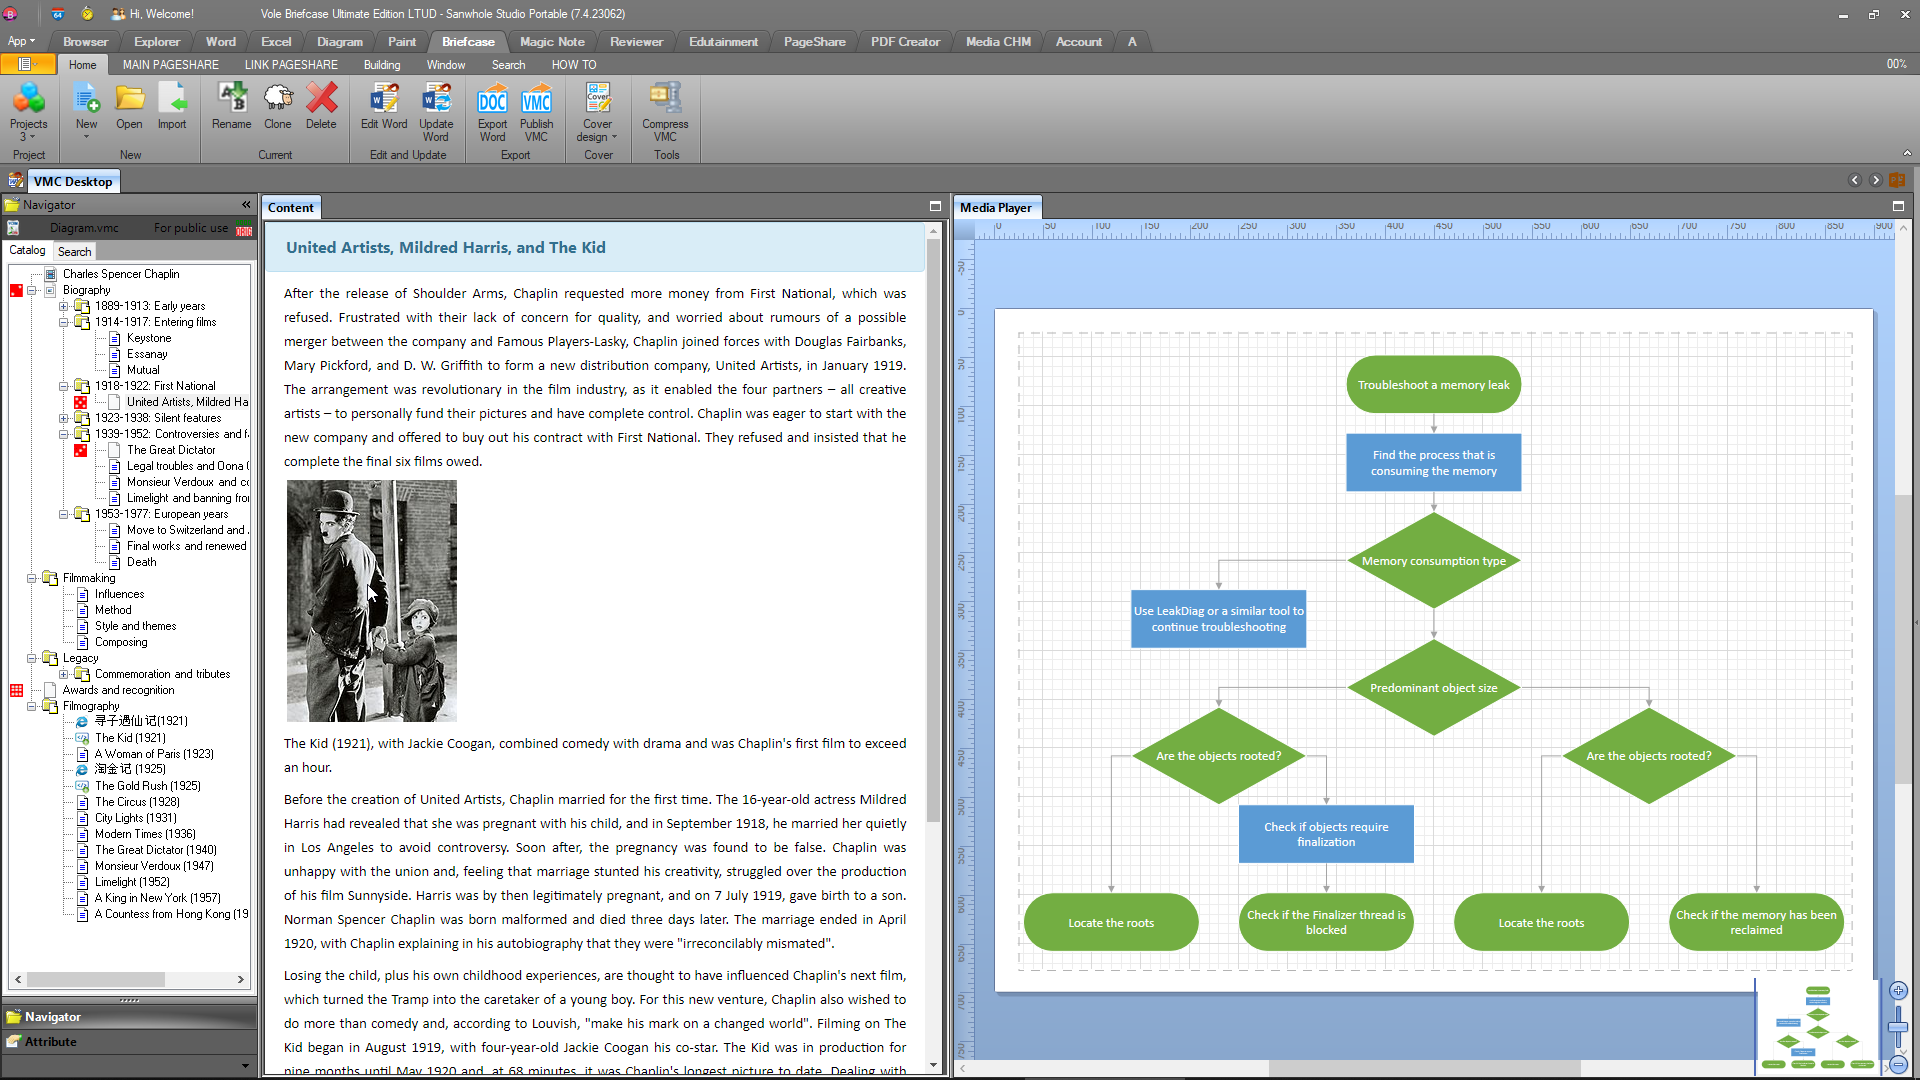
VMC support
Vole Briefcase, Vole Magic Note, Vole Edutainment and Vole Reviewer support embedding Vole Diagram files. You can add Vole Diagram XML files just like adding pictures or videos. VMC will automatically recognize and correctly display the XML file in built-in media player.
|
|